
 |
Turbo Tech: Compressor and Turbine Map Details
By Khiem Dinh
Khiem Dinh is an engineer for Honeywell Turbo Technologies at the time of this writing. All statements and opinions expressed by Khiem Dinh are solely those of Khiem Dinh and not reflective of Honeywell Turbo Technologies.
We have previously covered compressor wheel technology and also how compressor and turbine maps are generated. Now we are going to dive a little deeper into the details of the compressor map and all-mysterious turbine map. Furthermore, we are going to see how compressor wheel and turbine housing A/R changes affect turbine flow and efficiency.
The basic compressor map plots air flow and pressure ratio for a given compressor speed. On the vertical axis is pressure ratio which is the compressor outlet pressure divided by the compressor inlet pressure. We have mentioned this before, but what we neglected to mention was the type of pressure being measured; for compressor maps, we need to compare total pressures at the inlet and outlet of the compressor housing. The total pressure of a flow is segregated into ambient, static and dynamic pressures. We need to measure the total pressure due to different size piping changing velocities and therefore the dynamic and static pressures.
 |
| The pressure ratio calculated on compressor maps is generally a total-to-total pressure taking into account the ambient, static, and dynamic pressures. We need to use total pressure due to Bernoulli’s principle that the total pressure is constant along a streamline. Looking at the above diagram, let’s say that Area #1 is the compressor outlet and Area #2 is the larger diameter tube after the compressor outlet. The dynamic pressure is directly affected by the velocity of the air and that is a function of the area of the tube it is flowing through. Smaller area = higher velocity and vice versa. Because the areas of #1 and #2 are different, the velocities are different therefore making the dynamic pressures different. Because the dynamic pressures are different, the static pressures (the ones most often measured) are also different even though the total pressures are the same at #1 and #2. So if only the static pressure is measured, the incorrect pressure ratio may be calculated. |
Compressor maps also show a corrected mass flow and corrected compressor speed. While the maps are generated in a controlled environment, the conditions will not be exactly the same every time. Therefore, the mass flow rates and compressor speeds are corrected based on the environmental ambient pressure and temperature during testing.
 |
| Mass flow rate (Q) is corrected to reference values of temperature and pressure, much like how many chemistry calculations are done at STP(standard temperature and pressure). By correcting every test to the same reference temperature and pressure allows the maps to be confidently compared. The speed of the compressor (N) also needs to be corrected. |
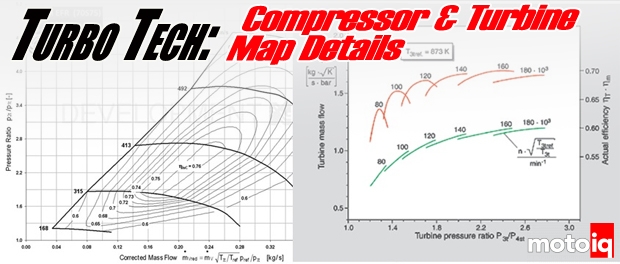
The turbine map is orientated differently than the compressor map with the pressure/expansion ratio on the horizontal axis and the corrected flow on the vertical axis; turbines are also known as expanders as the gas starts off at a high pressure entering the turbine and expand to a lower pressure as it exits the turbine. Therefore, when speaking specifically about turbines, the pressure ratio is also known as the expansion ratio. Back on topic to the turbine map, turbine efficiency also looks different as compared to the compressor map; there are efficiency lines which correspond to each compressor speed line with the efficiency values also plotted on the vertical axis.
 |
| Here is a real deal turbine map from Borg Warner. The top set of red curves are the efficiency lines and the bottom set of green lines are the flow rates each labeled with their corresponding compressor speeds. The turbine map also has corrected mass flow rates and corrected speeds just like the compressor map. However, one difference is how the turbine pressure ratio is calculated; the pressure ratio on the turbine side uses total pressure at the turbine inlet and static pressure at the turbine outlet. |


7 comments
Using the compressor map and engine specs, is there a way to calculate or estimate what the boost threshold will be for a turbo?
Yup, and more critically, the turbine map. I did an example here.
https://motoiq.com/turbo-tech-calculating-turbocharger-compressor-and-turbine-performance-advantage-with-the-new-honeywell-garrett-gtx-gen2/
You can do it easier with the Borg Warner Matchbot app online. There are many assumptions you will have to make if you don’t have real world data for your engine. And the biggest assumption is the turbine efficiency to use during spool-up. It’s all guesswork on the pulse effect which effectively increases turbine efficiency. A twin-scroll setup will have a much stronger pulse effect which is why they spool up turbos more quickly.
Assuming better turbine efficiency translates into more work being put into the shaft as torque to spin the compressor, how does a smaller a/r turbine housing produce better efficiency at higher flows and pressure ratios and a larger one better at lower flows and pressures. I always ran smaller a/r housings for spool and low boost set ups and bigger a/r housings for more boost at high rpm and flows with less backpressure.
I must be missing something in the charts but ive read it several times over. Great article
Good question and beyond my knowledge. Definitely some complex fluid flow stuff going on! On the second page with my plot of big and small A/Rs and their flow and PR curves for the same shaft speed, those are basically same shaft power curves. Turbine shaft power is a function of mass flow, PR, and efficiency. Pretending the efficiencies are the same, the big A/R uses higher mass flow to generate the shaft power and the small A/R uses higher pressure ratio.
The perfect A/R is where it is sized perfectly to generate the shaft power required and not wastegate any flow. This can be done on an application like a power generator set that runs at a constant speed and load all the time. Flow that is wastegated is basically like negative turbine efficiency. The more you have to wastegate, the more it basically brings down your effective turbine efficiency. Of course, if you actually want to have a wide powerband and be able to spool up at low rpms, you have to run a lower A/R and then wastegate the excess at the higher power levels.
Your turbine housing sizing strategy is not a bad one. With a low boost setup, that implies a low power target, so you don’t need a big A/R to keep the exhaust manifold pressure down. To generalize turbine housing sizing, run the smallest A/R that you can and still be able to hit the power target. The type of application does matter though. One that does a quick pull and sees minimal time at high turbine pressure ratio can get away with a smaller A/R and subject the engine to higher exhaust back pressure. But something like a road course race car, or gen set, that speeds all of its time at peak power, the goal would be to minimize exhaust back pressure. A street car that needs a lot of low-end torque for stop light action can have the turbine housings sized where the exhaust manifold pressure is one bar higher than the intake manifold pressure; so and engine delta pressure of negative one bar. For a road course car, one would want engine dP as positive as possible at peak power, while still having a broad enough powerband. It’s made easier these days with race transmissions that can keep the engine rpms high keeping a big A/R turbo in the range it stay spooled. And with new e-turbos, the turbine housing A/R can be made bigger because the integrated electric motor adds the shaft power when the exhaust flow is not enough.
Interesting article, thanks.
I’m confused by turbine maps showing mass flow plateau at a given PR. Does running at greater PR increase absolute turbine output or can it actually hinder it? I’ve seen a case where the addition of a second wastegate reduced back pressure considerably while increasing boost pressure at the same conditions.
Thank you.
The turbine maps show a corrected turbine mass flow. Corrected turbine mass flow is a function of actual mass flow divided by turbine pressure ratio. It’s typical to see the corrected turbine mass flow actually decrease at high turbine pressure ratios. That’s an indication the turbine pressure ratio is increasing faster than the actual turbine mass flow, so not a good thing.
Thank you very, very, much.