
 |
Compression Ratio – A Look From The Thermo Side
By Khiem Dinh
Khiem Dinh is an engineer for Honeywell Turbo Technologies at the time of this writing. All statements and opinions expressed by Khiem Dinh are solely those of Khiem Dinh and not reflective of Honeywell Turbo Technologies.
You want more power and probably better fuel economy due to ever increasing fuel costs. The government wants lower emissions. So how do you achieve all those? Increasing the compression ratio of the engine is one method. My old school naturally aspirated SR20DE had a compression ratio of 9.5 back in the 1990s. The S2000 came onto the scene around 2000 with a compression ratio of 11.0. Now modern performance cars like the Ferrari 458 and Porsche 911 have a compression ratio of 12.5. The upcoming Mazda Sky-G gasoline engine has an incredible 14.0 compression ratio achieved with some new technologies. Even turbo cars are upping the compression ratio all in the name of more power and fuel economy. The SR20DET had a compression ratio of 8.5 while the new Nissan Juke and Hyundai Sonata are 9.5. The 911 turbo is 9.8 which is higher than my old naturally aspirated SR20DE! So how does increasing the compression ratio do these things? We’re going to use that thing called thermodynamics to show you.
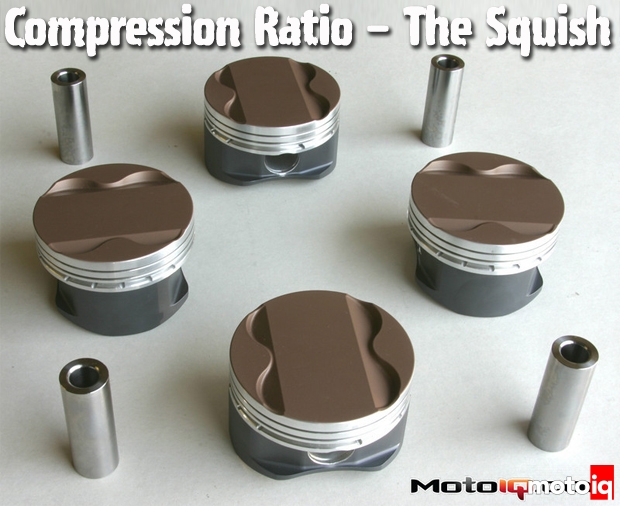
We're going to look specifically at the 4-stroke gasoline engine. If you need a quick refresher, read up on Suck, Squish, Bang, Blow. Compression ratio deals specifically with the squish and bang; more squish (compression) makes a bigger bang (get your heads out of the gutter). To see the effects of higher compression, we'll model the combustion process with the Otto cycle.
The Otto cycle makes a lot of assumptions like isentropic compression and constant volume heat transfer to simplify things, so stuff that is basically impossible in the real world. While you can't get accurate values, you can use the Otto cycle to make comparisons.
 |
| Here's the Otto cycle plotted on a P-V (pressure-volume) and T-S (temperature-entropy) diagram along with two of the corresponding strokes in the 4-stroke cycle. 1 to 2 is isentropic compression (entropy(s) is a constant). 2-3 is heat (Q) addition, or fuel being burned. 3-4 is the power stroke (isentropic expansion). 4-1 is heat being lost, basically out the exhaust and the water jacket of the engine block. The two strokes not shown are the intake and exhaust strokes. |
 |
| This diagram is more representative of the actual curves in the 4-stroke process. As you can see on the exhaust stroke, the pressure in the cylinder is a bit above atmospheric. The pressure on the intake stroke is a little under atmospheric for a naturally aspirated engine. These are both generalizations and represent some of the pumping losses in a gasoline engine. |