
 |
Don’t Trust Strangers! How Dynos Lie and When to Believe One
by Khiem Dinh
Khiem Dinh is an engineer for Honeywell Turbo Technologies at the time of this writing. All statements and opinions expressed by Khiem Dinh are solely those of Khiem Dinh and not reflective of Honeywell Turbo Technologies.
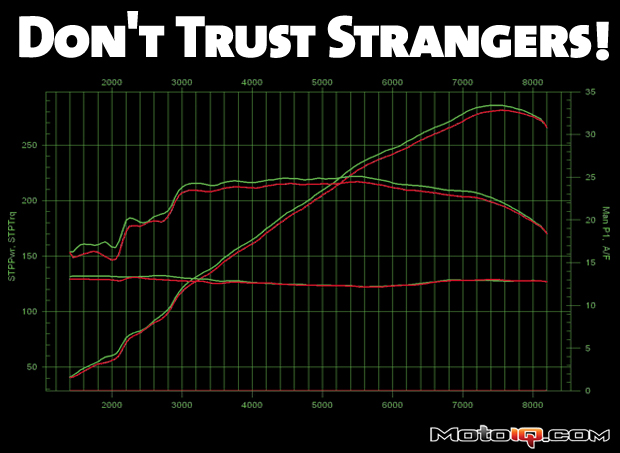
Ah yes, the dyno plot and power numbers. The dyno plot is the subject of many forum pissing matches, the holder of false prophecies, the teller of partial truths… Reading the forums, you would be led to believe that everyone had their car dyno’d on a “low reading” dyno. Well, except for in South Florida; there must be some magic octane booster in the air down there. Dynos are a great tool for tracking performance changes, but trying to compare across different dynos on different days with different cars is borderline meaningless. We’re here to tell you why. We’ll also tell you the best case for getting results you can compare.
First, we should give a very very (very) brief overview on dynos as related to cars. There are two main categories: engine dynos and chassis dynos. Big companies and race teams use engine dynos in highly controlled test cells that enable the operators to have extremely high accuracy and repeatability. Eric posted up a little bit about the engine dyno test cell at Cosworth here and here. The dynos that most people in the aftermarket industry are familiar with are chassis dynos where you attach a car and go. Because a chassis dyno measures at the wheels or hubs, additional rotating masses and frictional losses are taken into account.
To show how power is calculated, I did this quick little derivation. Now you also know why horsepower and torque always cross at 5252 rpms on a dyno plot (assuming horsepower and torque are plotted on the same scale axis). Did I mention that math and science are cool? I think I have before.
 |
| Power is equal to energy per unit of time. Energy is equal to a force times distance which just happens to be the same as torque. Because our distance is a wheel spinning, we have to throw in the 2* pi radians to convert revolutions into a distance value. I started off with SI units because they actually make sense. |
 |
| Why the heck does 1hp = 550 lb-ft/s? Why are there 12 inches in a foot or 5280 feet in a mile? That’s why I like working in SI units. Anyways, after doing all the unit conversions, you can see the silly 5252 down there. |
Let’s go into some of the reasons that you can’t compare numbers between different dynos. #1, there are a bunch of different types of dynos! Trying to compare absolute numbers between a Dynojet, Mustang Dyno, Superflow, Dyno Dynamics, Dynapack, and the other handful of dyno types just doesn’t work. Do the weight scales at the doctor’s office, gym, grocery store, and your bathroom all read exactly the same? I don’t think so. #2, even if they are the same type of dyno, their calibration could be off. In a manufacturing, scientific, or laboratory environment, every measuring device has to have its calibration checked often and certified to ensure its accuracy. How many dynos do you know of that get calibrated often? #3, the setup of the car can alter the dyno reading. If the tire pressures, type of tire, or alignment are different from a previous dyno session, the results will be altered. Even if the car is strapped down differently, that can alter the readings and strapping down the car to varying degrees can alter the alignment as the suspension compresses.
 |
| The guys at Edmunds Inside Line strapped down a Lexus LFA to an in-ground Dynojet chassis dyno at MD Automotive. |